Help Articles
Market Position Tracker FAQ
Getting Started with Market Position Tracker
Q: What is Market Position Tracker and how is it different from regular rank tracking?
Market Position Tracker is a competitive intelligence feature that shows your overall market position against competitors, not just individual keyword rankings. While traditional tools show where you rank, Market Position Tracker reveals whether you're actually winning market share by tracking Position Gains, Declines, New Positions, and Win Rate against specific competitors over time. It transforms raw ranking data into strategic business intelligence that helps you understand if you're gaining or losing ground in your market.
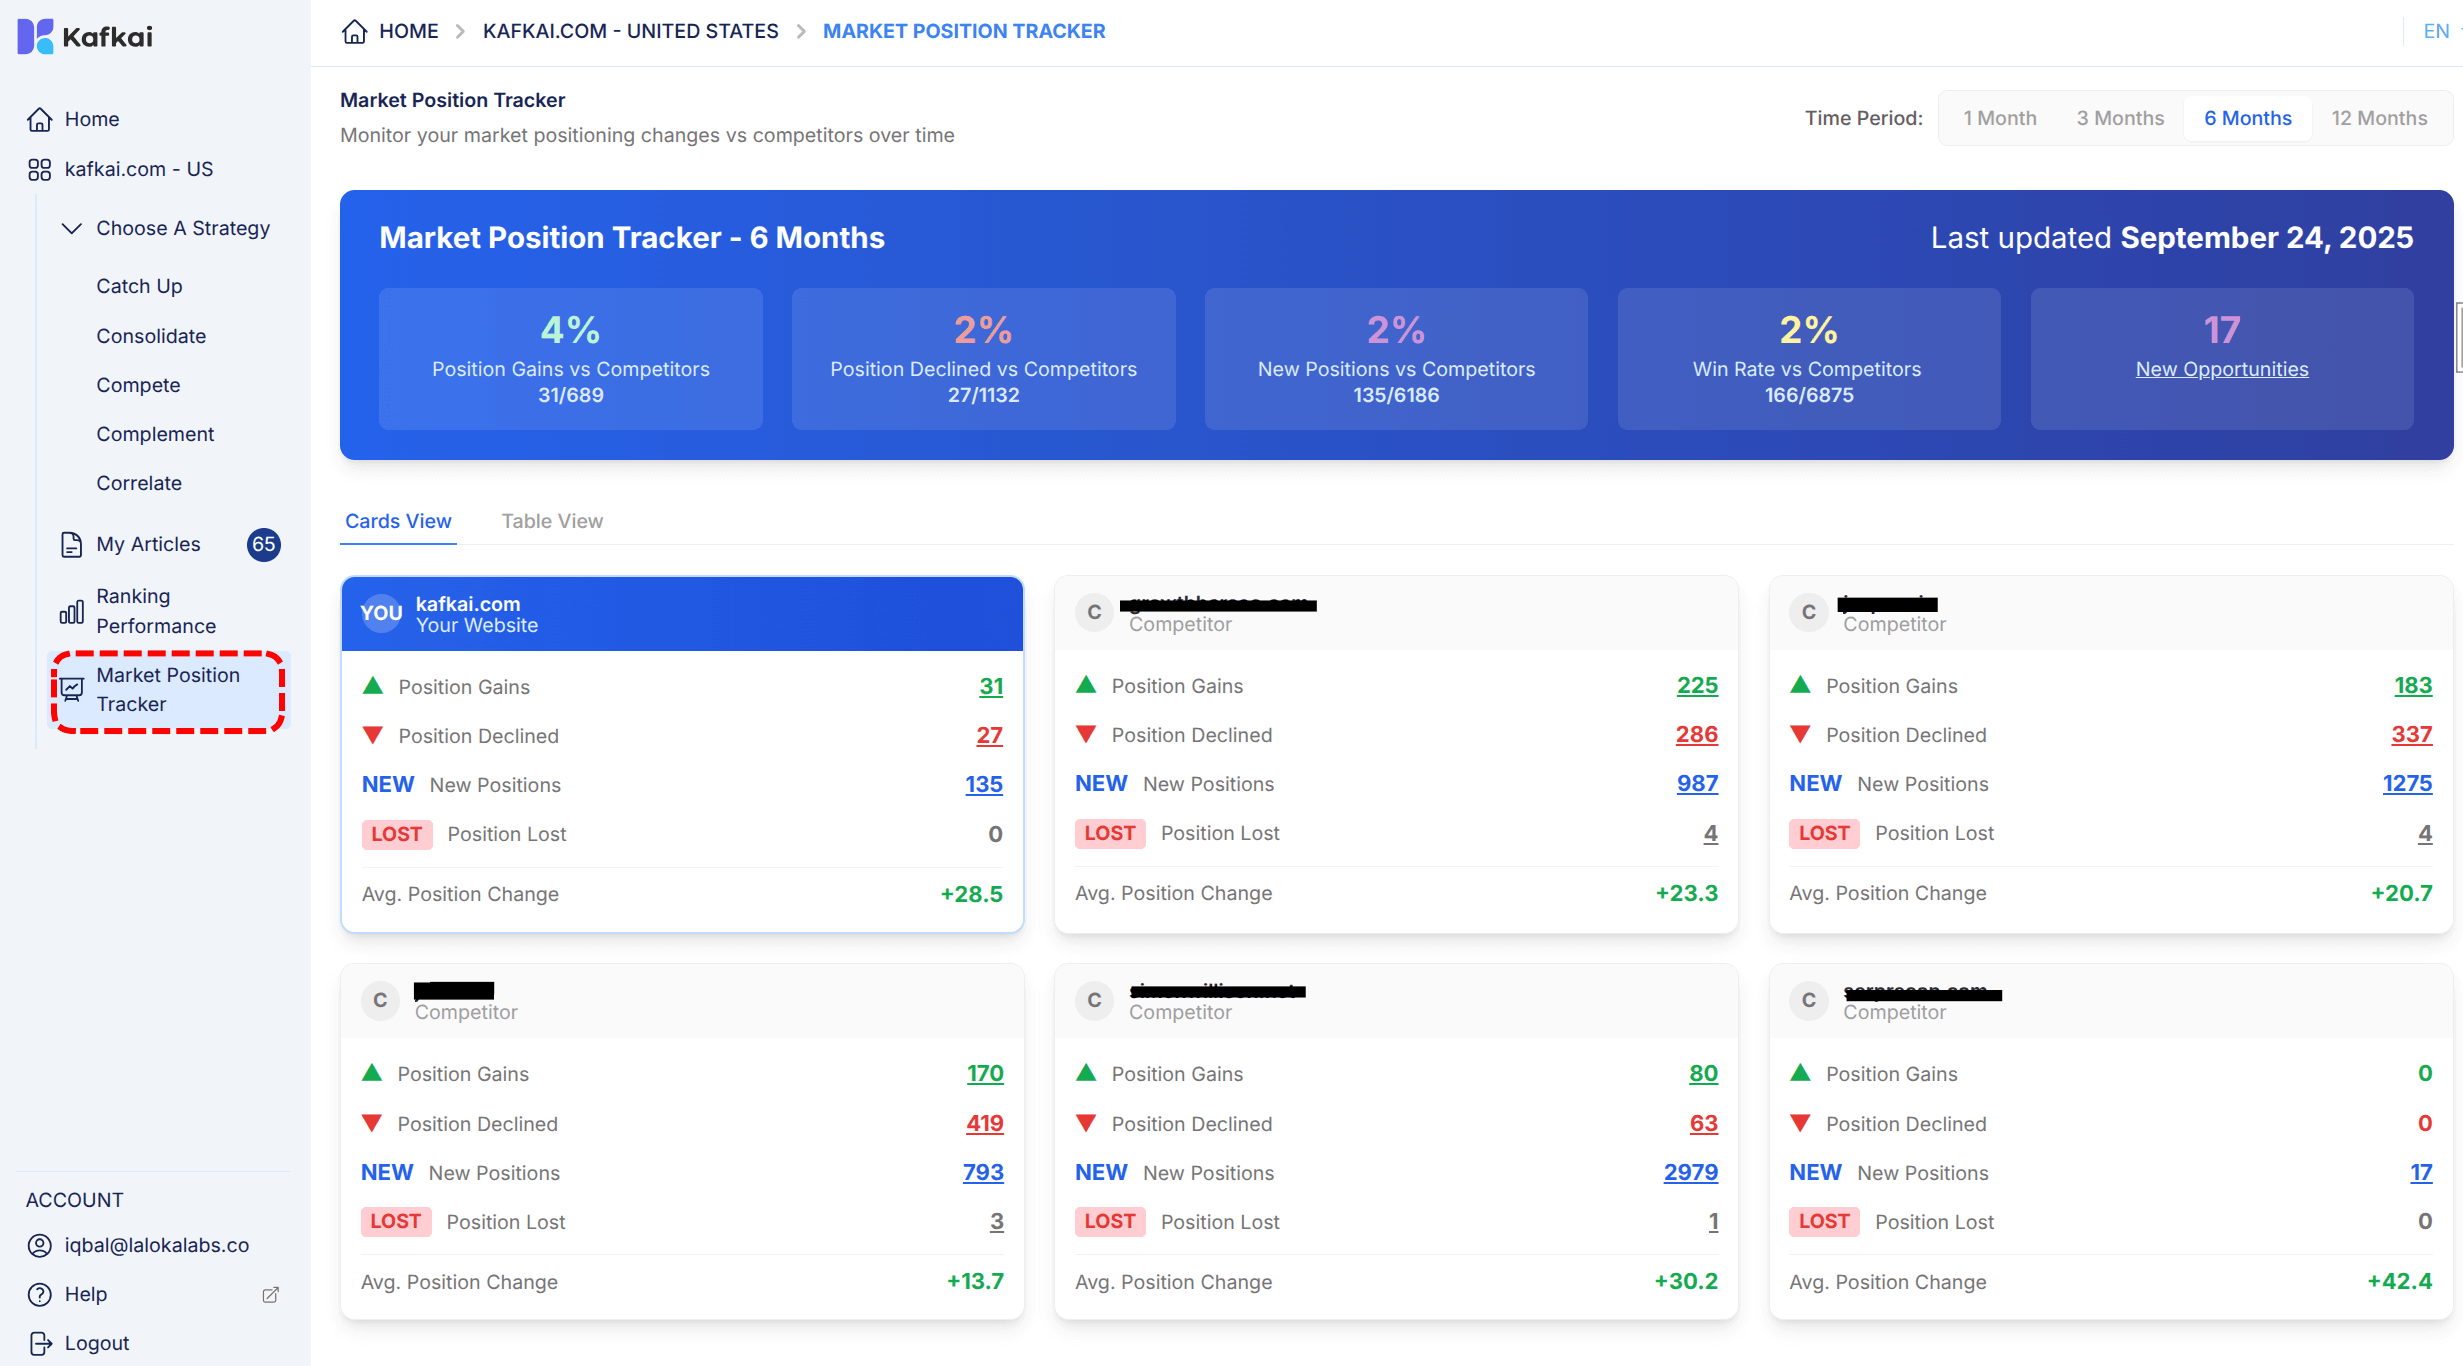
Q: How do I access Market Position Tracker?
To access Market Position Tracker:
- Log into your Kafkai account
- Navigate to any project
- Click "Market Position Tracker" in the left sidebar
- Select your desired time period (1, 3, 6, or 12 months)
The feature is available for all plans. For more details, see our release announcement.
Understanding Your Metrics
Q: What do the key metrics mean and how should I interpret them?
Key metrics include:
- Position Gains: Keywords where you've climbed rankings vs competitors (e.g., 4% means you're gaining on 31 of 689 keywords)
- Position Declines: Keywords where competitors are outpacing you
- New Positions: Fresh opportunities where you've entered the rankings for the first time
- Win Rate: Your overall performance in competitive battles (e.g., 2% Win Rate means winning 166 of 6875 competitive battles)
- Average Position Improvement: The mean change in your ranking position
These metrics show not just movement, but whether that movement translates to competitive advantage.
Q: How do I know if a change is significant or just normal fluctuation?
Use longer time periods (3-12 months) to distinguish real trends from temporary fluctuations. A 2-4% change over 1 month might be noise, but the same change sustained over 3-6 months indicates a real competitive shift. Focus on patterns rather than individual data points, and drill down into specific keywords to understand the impact on your business.
Using the Interface Effectively
Q: What's the difference between Cards View and Table View, and when should I use each?
Cards View provides quick, at-a-glance insights for each competitor, ideal for daily monitoring and quick check-ins.
Table View offers detailed comparative analysis across all metrics and competitors, perfect for deep dives and comprehensive reporting. Use Cards View for high-level monitoring and Table View for weekly/monthly strategic reviews or when presenting data to stakeholders.
Q: How can I drill down to see which specific keywords are driving the changes?
Click on any metric (e.g., Position Gains, Win Rate) to see exactly which keywords drove the change. This reveals the specific search terms where you're gaining or losing ground, allowing you to identify content opportunities, understand competitor strategies, and prioritize your content creation efforts based on actual competitive performance rather than guesswork.
Strategic Implementation
Q: How can I turn Market Position Tracker insights into actionable content strategies?
Use the insights to implement the 4Cs Framework:
- Consolidate: Double down on keywords where you're gaining position—create supporting content to strengthen your lead
- Catch-up: Prioritize content for keywords where you're declining to close competitive gaps
- Compete: Defend strong positions against aggressive competitors by refreshing and improving existing content
- Complement: Explore new keyword opportunities where you've entered rankings
Generate content directly from these insights using Kafkai's AI to systematically address each category.
Q: Which time period should I choose for different business purposes?
Select timeframes based on your strategic needs:
- 1 month: Track immediate impact of recent content and identify quick wins
- 3 months: Assess quarterly performance and campaign effectiveness
- 6 months: Evaluate medium-term trends and seasonal patterns
- 12 months: Understand long-term market position evolution and year-over-year growth
Longer periods smooth out fluctuations and reveal sustainable trends, while shorter periods help you respond quickly to competitive moves.
Troubleshooting and Support
-
Q: What should I do if I see a sudden decline in my Win Rate?
A sudden decline is an early warning that competitors are outperforming you. Immediately drill down into Position Declines to identify affected keywords, analyze competitor content that's winning, and prioritize creating more comprehensive, targeted content for those terms. Consider it your competitive threat detection system—act quickly to defend your market position. -
Q: How often is the competitive data updated?
The data is updated regularly as part of Kafkai's keyword tracking system. For the most current update frequency for your specific plan, refer to your project's keyword data settings or contact our support team at [email protected]. -
Q: Can I export or share the Market Position Tracker data?
Currently, you can share insights by taking screenshots or manually compiling data from the Table View. For detailed reporting, use Table View to gather comprehensive metrics. We're exploring enhanced export features based on user feedback—contact us at [email protected] if this capability is important for your workflow. -
Q: What if I need help interpreting my competitive data?
Our support team is here to help you make sense of your competitive intelligence. Contact us at [email protected] with specific questions about your metrics, and we'll provide guidance on turning insights into action. For strategic consulting, consider reaching out to our customer success team for personalized training.
Last updated -